
Task 1-A samples with tips and answers
Sample 1
Pie chart
Sample 2
Diagram
Sample 3
Line graph
Sample 4
Bar chart
IELTS Academic Writing Task 1
In this task you will be presented with a graph, table, chart or diagram and asked to describe, summarise or explain the given information.
How to answer IELTS Academic Task 1?
1) Analyse the graph
Firstly, you need to get an overview of the graph/chart/diagram you will describe. Look for general trends, changes and key features to get an idea of how you will structure the information.
Example:
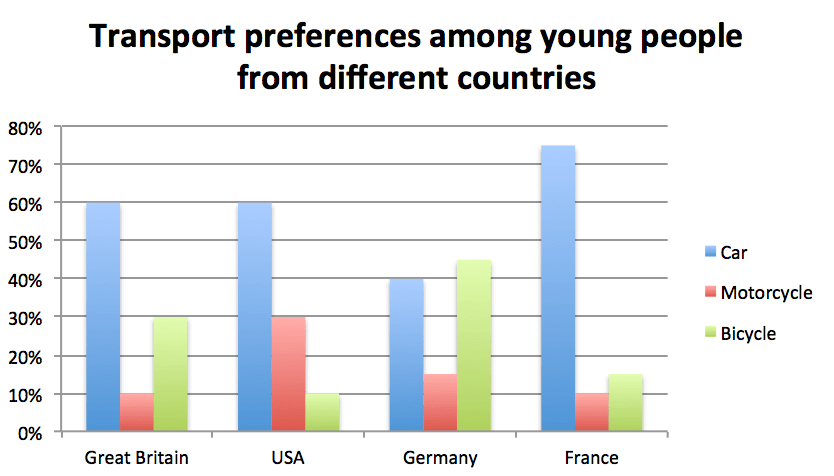
We can note some trends :
- Car was the most popular type of transport in all countries, except for Germany.
- In Great Britain and USA, there are big differences between percentages of people who choose some kind of transport.
- In Germany, percentages of people who choose car and bicycle are roughly the same.
- In France, percentages of people who choose motorcycle and bicycle are nearly equal.
- Motorcycle was the least popular type of transport in all countries, except for the USA.
- Overall, car is the most chosen transport, bicycle is on the second place and motorcycle is the least chosen transport.
2) Write an answer with the following structure:
Once you've thought out all patterns on the graph, you can start writing your answer.
Introduction |
Introduce the graph (ideally 1-2 sentences). |
|
Body |
||
General overview |
In this paragraph you should describe main trends. |
Specific features |
Group the given data by some feature. Then describe each feature. Use paragraphing! Usually, there should be 1-3 paragraphs in the body part. |
You can learn more about how to answer Writing task 1.
Don't forget to use special vocabulary to describe graphs and linking structures. Also use words from academic wordlist.
Don't worry if you think there is too much or not enough information!
Remember that the purpose of Academic Task 1 is to test your ability to distinguish and describe the changes and trends you see on the graph.
If you think that there is not enough information on the graph to write 150 words: don't panic! Write in detail about every single alteration and support your writing with a lot of data.
If you think that there is too much information on the graph: also don't panic! Don't ornately depict each change on the graph, but try to see a few main trends instead.