
IELTS Academic Writing Task 1. Sample 3
You should spend about 20 minutes on this task.
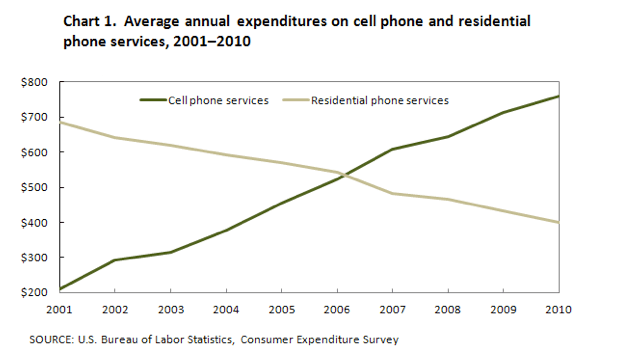
The graph shows average annual expenditures on cell phone and residential phone services between 2001 and 2010.
Summarize the information by selecting and reporting the main features, and make comparisons where relevant.
Write at least 150 words.
How to answer this task?
-
Introduce the line graph.
Write what it illustrates.
-
Give an overview.
Briefly summarize what happens on the graph.
-
Apart from obvious trends, see some less noticeable features.
Where did the graph rise/decline sharply and where slowly? What is the difference between initial and final figures? Where did the recors meet?
-
Describe each change on the graph in a separate paragraph.
This graph is a good example of a situation when students get confused, thinking there is not enough information to write 150 words. In this case, make a lot of comparisons, support your assertions with data and paraphrase the written information. Use vocabulary to describe graphs, linking structures and words from academic wordlist .
Model answer
The line graph illustrates the average cost that American customers spent on mobile and landline phone services annually over a 10-year period.
Overall, spending on residential phone services dramatically declined, while popularity of mobile services increased sharply throughout a decade. Also, both of services met at the same record in 2006.
In 2001, spending on mobile phone services began by merely $200, while the amount of annual expenditure on the residential phone services was around $700. Over the following five years, expenditure on landline phone services gradually dropped below $600, whereas expenditure on cell phone services rose to just over $500.
In 2006 cell phones overtook landline phones, and the services became equal in popularity with customers' annual expenditure of about $550. Then, cell phone expenses rose to approximately $750 in 2010, making nearly a fourfold jump relatively to its initial figure in 2001. Meanwhile, spending on residential phone services experienced a steep fall in 2007 and went on to steadily decrease for the rest of the period.
(168 words)